How quickly can you read a blog post? Many people will not take the time to completely read something unless they are already hooked. Infographics are a great way to grab your reader’s attention and get them to want to read through the rest of your content.

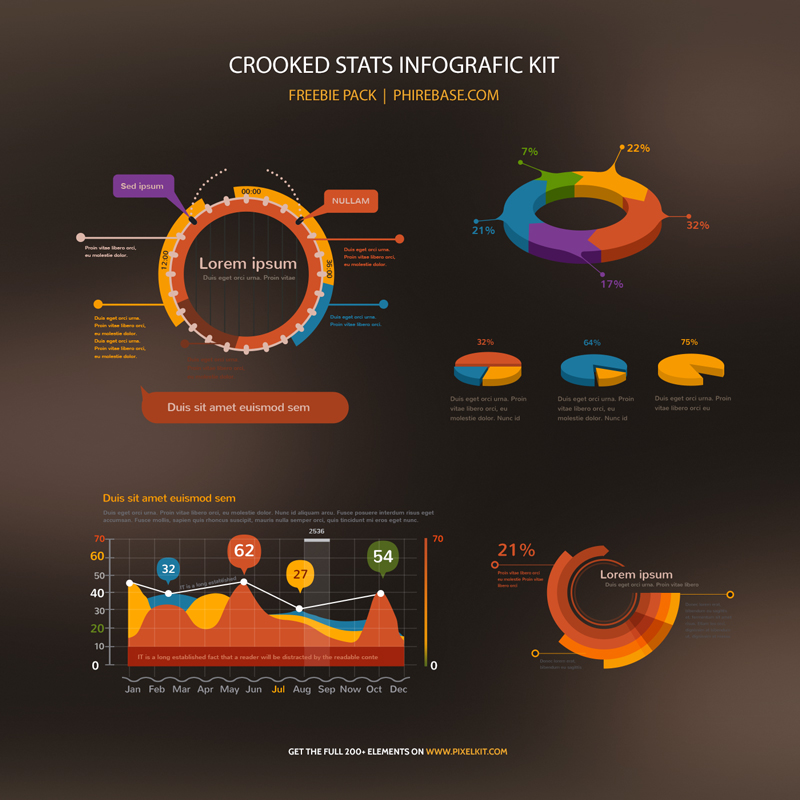
Crooked Stats Infographic Kit is a great help when you want to create an outstanding representasion of your information. In the freebie kit you will find a PSD file that include waves graphs, interesting pie charts, futuristic circles graph and much more that could be a great addition to your site.
This nice infographic kit was developed by PixelKit – an enormous library of UI kits and icon sets. PixelKit is compatible with 960 grids, so you shouldn’t have any difficulty including the graphics in any HTML structure. All the kits that you utilize on PixelKit are loaded with thousands of different graphics. This makes life so much easier for designers, in that small discrepancies between one type of an icon and another one render any given UI kit unusable.
No matter what a client needs, there should not only be a selection of different icons available in PixelKit to accommodate that need, there should also be other UI elements that integrate fully with the theme and that give excellent results on the most professional and demanding jobs.
Check out this special treat– the Free PixelKit Bootstrap UI Kits. You can download these modern HTML Bootstrap templates and use it to make your design even more functional and cool looking.


0 Comments